Why The World’s Leading Data Experts Warn Covid-19 Data is Wrong
Data
And how to make better decisions from the data you see
As states are slowly starting to ease lock down restrictions and phasing reopening businesses, data is playing a big role in helping policy makers and leaders to both form and execute these decisions. But there is one question that must be asked in this process–is the data used to make these decisions correct?
In short, the answer is not always.
Enter Exhibit A: one of the leading models in the early phases of the pandemic in the U.S. went from rising star, consulted daily by White House officials, only to be put in a corner with a dunce cap after concerning inaccuracies were brought to light. The University of Washington’s Institute for Health Metrics and Evaluation, or IHME, was being used by White House officials, the Centers for Disease Control (CDC) and state officials around the country. This model formed the basis of NPR’s popular state-by-state peak predictions and was used by many other credible news agencies.
Ruth Etzioni, biostatistician at the Fred Hutch Cancer Center said the IHME model makes her cringe. In a STAT article she stated, “That it is being used for policy decisions and its results interpreted wrongly is a travesty unfolding before our eyes.” Epidemiologist Marc Lipsitch of the Harvard T.H. Chan School of Public Health said of the IHME model, “It’s not a model that most of us in the infectious disease epidemiology field think is well suited” for projecting Covid-19 deaths.
The root of concern from data experts was a glaring issue.
The IHME model had predicted that Covid-19 deaths would reach 60,000 by the end of August. This was problematic because deaths in the US had already reached 68,000 by the beginning of May. On May 4th the IHME called a press conference to release their model update with a new prediction of 134,000 deaths by the end of August, more than double the previous estimates.
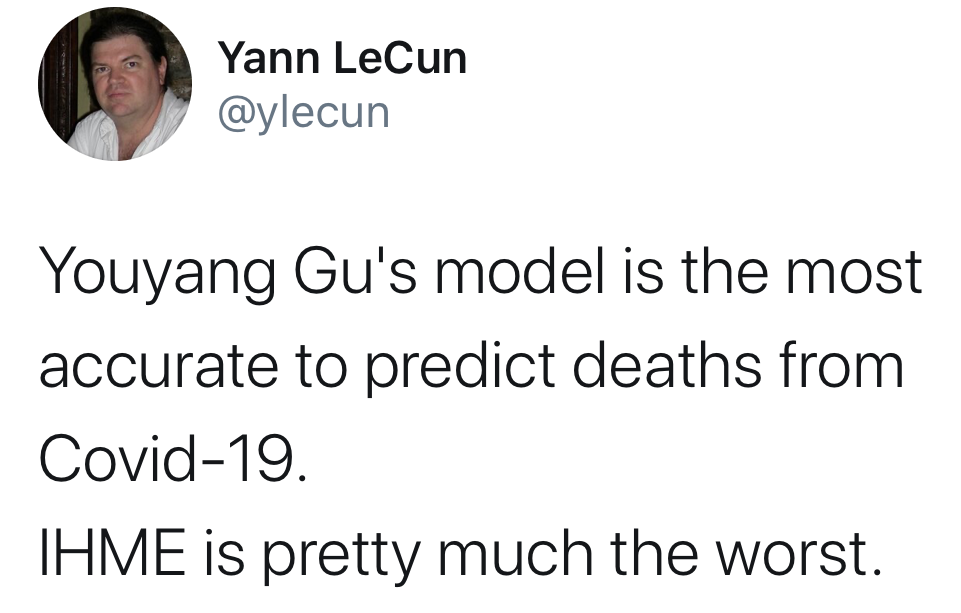
Yann LeCun, Facebook’s Chief AI Scientist described IHME’s model in a tweet on May 18 as “pretty much the worst.”
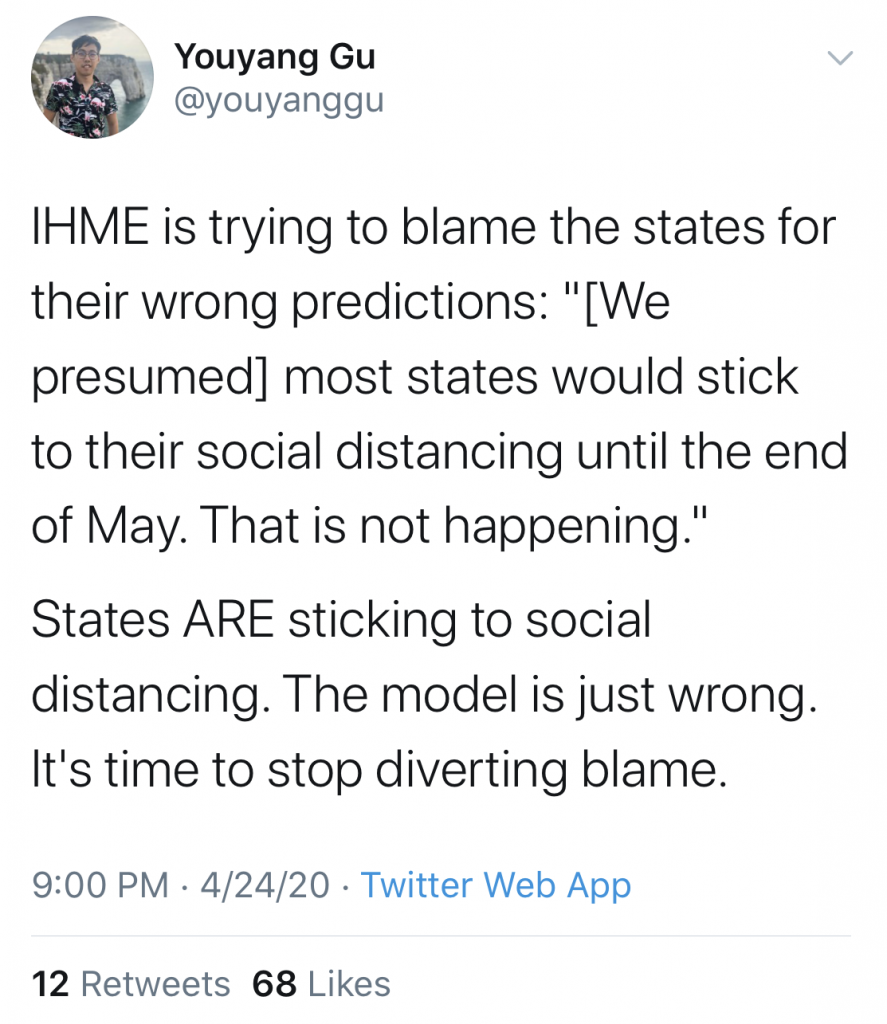
Youyang Gu is a Data Scientist (MIT ’15) and creator of the covid19-projections.com model. This model is now one of 17 Covid-19 data models linked on the CDC’s site. Early in the pandemic he repeatedly expressed concerns over the IHME model.
Due to the mounting concerns over its inaccuracies, on May 1 the CDC quietly removed the IHME model from their website. And just like that, one of the leading data sources used by Americans was put on the shelf. The takeaway for Americans—just because we see data does not mean that it’s correct. Especially in the middle of a pandemic where all we have to go off of is a relatively small amount of very new data.
Harvard Professor of Statistics Xiao-Li Meng warned of the consequences of the poor quality of Covid-19 data that is currently available. He argues in his May 14th publication for the Harvard Data Science Review that academic studies on Covid-19, while conducted thoughtfully, are “dangerous” when researchers do not take into account the low quality of most of the Covid-19 that is available today. According to him, data quality is of utmost importance:
Building elaborated epidemiological or mathematical models without taking into account the weaknesses of the data generating mechanism is still statistically unprincipled, because data quality fundamentally trumps everything else.
Sadly, this is not the only data fail since the Covid-19 pandemic arrived in the U.S. In their May 21st article “How Could the CDC Make That Mistake?” The Atlantic reported that the CDC and several states including Pennsylvania, Georgia and Texas were mixing viral test data with antibody test data, damaging the public’s ability to understand what is happening in any one state. Harvard Professor of Global Health and director of the Harvard Global Health Institute K. T. Li said that blending viral and antibody tests “will drive down your positive rate in a very dramatic way.” As a consequence of this error, some of the metrics that decision makers have depended on for state reopening plans have been wrong, and we do not actually know how our ability to test people who are sick with Covid-19 has improved. The conflating of viral and antibody tests is a clean cut example of how easy it is to dramatically skew data.
Over the past 3 months, we have all been consuming data daily in an effort to track this pandemic. So to uncover the inaccuracy of key data we have relied on is nothing short of frustrating. But there is a lesson in all this madness: no data is perfect.
Data quality fundamentally trumps everything else
In my 2017 talk for TEDxProvidence I amplified the limitations of data. Having loads of data and data scientists does not guarantee our ability to make accurate predictions. Botched predictions for both the 2016 U.S. Presidential Election and the Brexit decision are sobering examples of this. It’s happened again with Covid-19 projections, and we’ll keep seeing the same pattern repeat in the future. This will continue because the innate nature of data is imperfect.
So what do we do with all of this?
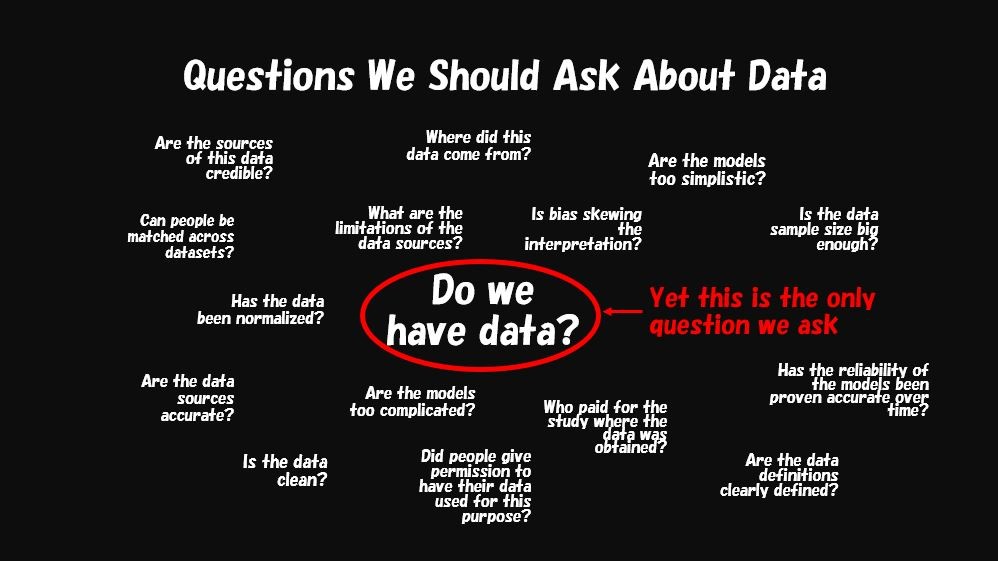
The takeaway here is that every person should know that data is always flawed. Whether you’re a CEO or just someone who is trying to make sense of what’s going on, we need to understand a few basic principles when looking at data. Cassie Kozyrkov, Head of Decision Intelligence at Google put together a very succinct and helpful list of “dos” and “don’ts” for interpreting Covid-19 data.
A few takeaways to keep in mind as it relates to pandemic data:
There are many different ways to measure what appears to be the same thing. The fact that some states have been lumping viral and antibody tests together and others have not is a problem. Mistakes like this happen when we don’t question how data is being measured.
Never blindly trust data or a model. While no one model is perfect in its ability to predict the future, we use models as a tool to assist with health care and resource planning. In the case of the IHME model, its inaccuracies were concerning enough to discontinue using it for policy decisions. Just like the imperfect data used to make them, data models are imperfect, too.
A better understanding of the subject matter leads to better understanding of the data. It’s a dangerous trap to fall into when we don’t have a deep knowledge of the type of data we’re looking at. Data is more accurately interpreted by those with a deep understanding of the data sources, clinical measures, and the spread of infectious diseases. There are certain areas where we do need to trust experts.
Finally, when it comes to matters of using data to make personal decisions in a pandemic, safety is the most important thing. No amount of data will make you discover that frequent hand washing, social distancing and wearing a mask are the wrong choice. As the author of The Black Swan Nassim Taleb stated, “It’s a situation where you can’t afford to be wrong even once.”
* * *
Shannon Shallcross is Co-Founder and CEO of BetaXAnalytics